PENALTY CORNER ANALYTICS

OUR TEAMS
Teams using the Penalty Corner Analytics services
In our first 2 seasons, we have already worked with 7 different programs from Division I and Division III, as well as the Uruguayan National Team. Here are some of our achievements during this period of time:
Division I Conferences with PCA Pressence
Division III Conferences with PCA Pressence


Regular Season Conference Championships
Tournament Conference Championships

3

4
Our teams win on average 1 Conference Championship a year
Division I Records
APC


DPC


Set Pieces


Immediate Impact
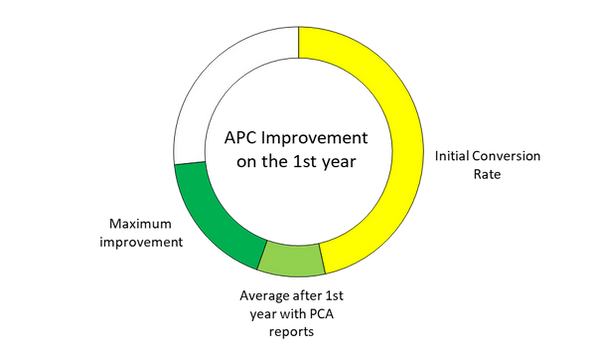
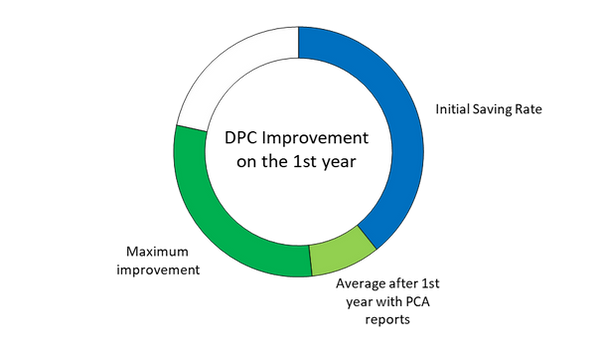
Teams using our services have shown great results since the first day. This is how our reports have impacted our teams on their first year:
Attacking Penalty Corners
Just on the first year using our reports, teams have improved their APC conversion rate 2.22 points on average, with some teams reaching nearly a 7 point improvement.
The combined balance for our teams after the first season, has a positive impact of 13.29 points total.

+02.22
+06.70

+02.26
+09.80
Defensive Penalty Corners
For DPC saving rate, on the first year using our reports, teams have improved by 2.26 points on average, with some teams reaching around a 10 point improvement.
The combined balance for our teams after the first season, has a positive impact of 13.55 points total.


+ 13.55
On average, teams see a total increase on their penalty corner performance
of 4.48 points just on the first year.

+ 13.29
Practical Case
Here is a real case of a team who added our Scouting Reports to their game preparation after the first 3 matches of the season:
